Understanding OpenTelemetry Collectors
In my previous article , I gave a brief overview of what OpenTelemetry Collector is and how it gets used in the OpenTelemetry framework with an example of a sampling demo. In today’s article we will be doing a bit deep dive in to the architecture and also try to look at some nuances of deploying Collectors in production, if possible.
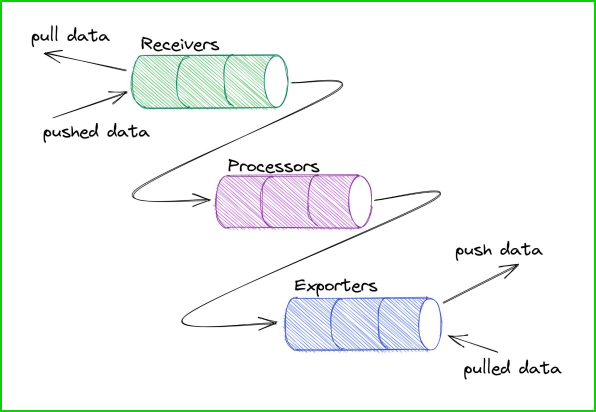
At a high level, there are 3 key components of a Collector as shown in the diagram below.

OpenTelemetry components
The Collector consists of three components that access telemetry data:
- Receivers — A receiver, which can be push or pull based, is how data gets into the Collector. Receivers may support one or more data sources. In our sample configuration, we have configured the receiver to be an OTLP source i.e an OpenTelemetry agent generating the telemetry data.
- Processors — Processors are run on data between being received and being exported. Processors are optional though some are recommended. Processors are very useful when you want to do sampling, adding custom attributes etc.
- Exporters — An exporter, which can be push or pull based, is how you send data to one or more backends/destinations. Exporters may support one or more data sources. Once the processing is completed, the data can be exported by the Collector to the required destinations.
Before going deep dive, lets look at a sample collector configuration to understand the configurations. We see 4 key sections in the configuration i.e receivers , processors , exporters and service/pipelines.
receivers:
  otlp:
    protocols:
      grpc:
      http:processors:
  batch:exporters:
  otlp:
    endpoint: otelcol:4317
  zipkin:
    endpoint: "http://localhost:9411/api/v2/spans"
    tls:
      insecure: true
service:
  pipelines:
#separate pipeline for traces, metrics and logging
    traces:
      receivers: [otlp] #First get data uing OTLP
      processors: [batch] #Process the traces using batch processor
      exporters: [otlp, Zipkin] # export the traces using OTLP & Zipkin exporter
    metrics:
      receivers: [otlp]
      processors: [batch]
      exporters: [otlp]
    logs:
      receivers: [otlp]
      processors: [batch]
      exporters: [otlp]
All of these components once configured must be enabled via pipelines within the service section.
Service
The service section is used to configure what components are enabled in the Collector based on the configuration found in the receivers, processors, exporters, and extensions sections. You can choose which receiver, processor & exporter to be used for a particular pipeline. If a component is declared, but not defined within the service section then it is not enabled. The service section consists of three sub-sections:
- extensions — Extensions are used primarily for tasks that do not involve processing telemetry data. Examples of extensions include health monitoring, authentication etc.
- pipelines — A pipeline consists of a set of receivers, processors and exporters. This is the heart of the pipeline where most of the processing takes place.
- telemetry-Telemetry is where the telemetry for the collector itself can be configured. It has two subsections:
logsandmetrics.
A pipeline consists of a set of receivers, processors and exporters. Each receiver/processor/exporter must be defined in the configuration outside of the service section to be included in a pipeline. Pipelines can be of the following types:
- traces: collects and processes trace data.
- metrics: collects and processes metric data.
- logs: collects and processes log data.
Pipeline defines a path the data follows in the Collector starting from reception, then further processing or modification and finally exiting the Collector via exporters. You can chain the processors and it will get executed in the order of its definition.
Lets look at the example used in my earlier article — otel-config-tail.yaml
processors:
  #groupbytrace:
  groupbytrace/custom:
    wait_duration: 2s
    num_traces: 1000
  tail_sampling:
    decision_wait: 10s
    #num_traces: 100
    #expected_new_traces_per_sec: 10
    policies:
      [

          {
            name: stop-health-checks,
            type: string_attribute,
            string_attribute: {key: http.target, values: [\/health],enabled_regex_matching: true, invert_match: true}
          }
      ]service:
  pipelines:
    traces:
      receivers: [otlp]
      processors: [groupbytrace/custom ,tail_sampling]
      exporters: [zipkin]
The trace pipeline uses 2 processors i.e groupbytrace/custom and tail_sampling. The groupbytrace/custom processor’s job is to group all the spans of the same trace , waiting a pre-determined amount of time before releasing the trace to the next processor. This is useful when you want to process a trace as a whole and not at Span level. A tail sampling processor gets to sample the complete trace on the feed received the groupbytrace processor. Preceding the tail sampling processor by the groupbytrace processor in the pipeline compliments the job done by tail sampling processor , as it needs a full trace for making the sampling decision.
A single exporter is configured to export the data to a Zipkin backend. However, when multiple exporters are configured in the pipeline, then the collector is responsible to fan-out the trace data to all the exporters. Fan-out means that the same trace/spans data will be sent to all the configured exporters.
To visualize this concept take a look at this diagram

We can also use a single receiver for multiple pipelines. You can also define multiple traces pipelines as shown in the example below.
service:
  pipelines:
    traces:  # a pipeline of “traces” type
      receivers: [OTLP]
      processors: [memory_limiter, batch]
      exporters: [jaeger]
    traces/2:  # another pipeline of “traces” type
      receivers: [OTLP]
      processors: [batch]
      exporters: [jaeger]
Please note that multiple pipelines can use the same exporter as shown in the above diagram.
I hope the configurations are better understood by now and you are excited to learn more about the deployment patterns. Since this post is already bit long and heavy, we will be looking at the various deployment patterns to deploy a Collector in production in the next article. stay tuned !!
References :
- https://speakerdeck.com/jpkroehling/opentelemetry-collector-deployment-patterns
- https://github.com/open-telemetry/opentelemetry-collector/blob/main/docs/design.md
- https://opentelemetry.io/docs/collector/configuration/
- https://github.com/open-telemetry/opentelemetry-collector-contrib/tree/main/processor/groupbytraceprocessor
- https://github.com/open-telemetry/opentelemetry-collector-contrib
